Data Plus

Interactive intelligence dashboards
for your multifamily portfolio.

Data Plus is a bring-your-own-data dashboard suite that gives multifamily operators instant access to Asset Pulse, Lease Up Tracker, and Turnover Tracker — three purpose-built interactive intelligence dashboards that run on your data without requiring the RevRE BI Tool.

Works with Your own data No BI Tool required 3 dashboards included
apartment building
Apartment kitchen
3 Purpose-built intelligence dashboards
BYOD Bring your own data — no migration required
No BI RevRE BI Tool not required
Live Always-current portfolio intelligence
The Dashboards

Three interactive intelligence dashboards. Instant portfolio visibility.

Data Plus bundles three purpose-built interactive intelligence dashboards that give your team the portfolio visibility they need — without building dashboards from scratch, without a BI tool, and without an analyst in between.

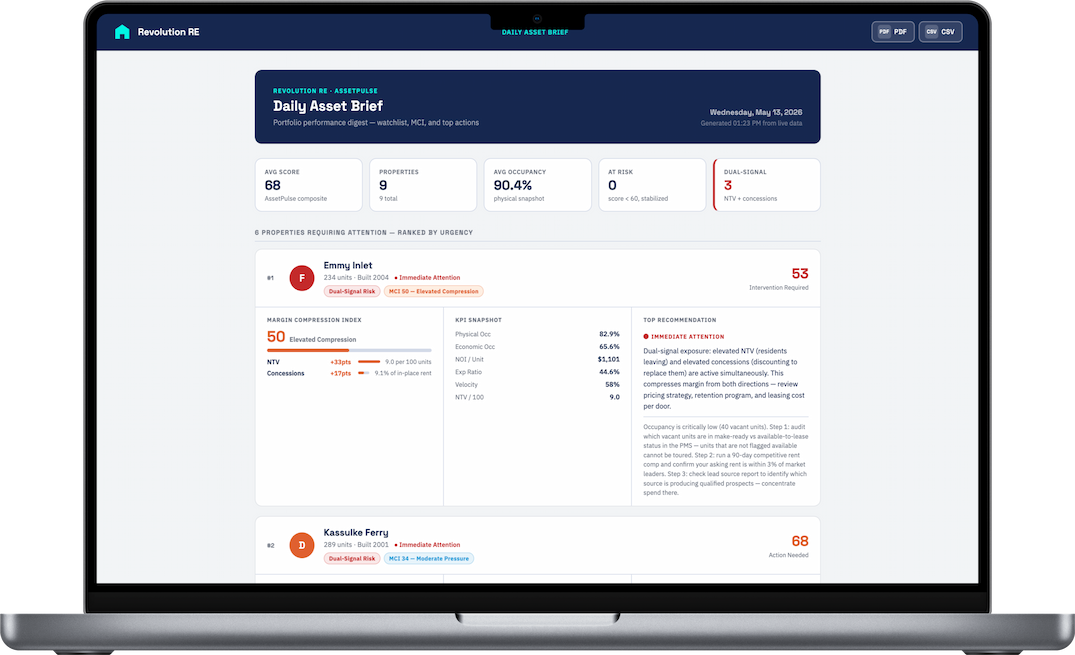
Asset Pulse interactive dashboard — Daily Asset Brief view
Dashboard 01

Asset Pulse

Asset Pulse is a complete portfolio intelligence dashboard with four connected views — so your team can move fluidly from a 30,000-foot read on the whole portfolio down to a daily property-level check-in. Live scoring across every property, no analyst in between.

Portfolio View — every property scored and ranked side-by-side, with risk flags surfaced across occupancy, revenue quality, delinquency, and NOI
Property View — a deep dive into a single asset's performance trends, KPIs, and AssetPulse Score drivers
Daily Asset Brief — an at-a-glance morning read of what changed overnight across the portfolio
Property Audit — a structured review of data quality, anomalies, and the metrics worth investigating before they become problems
Bring your own data
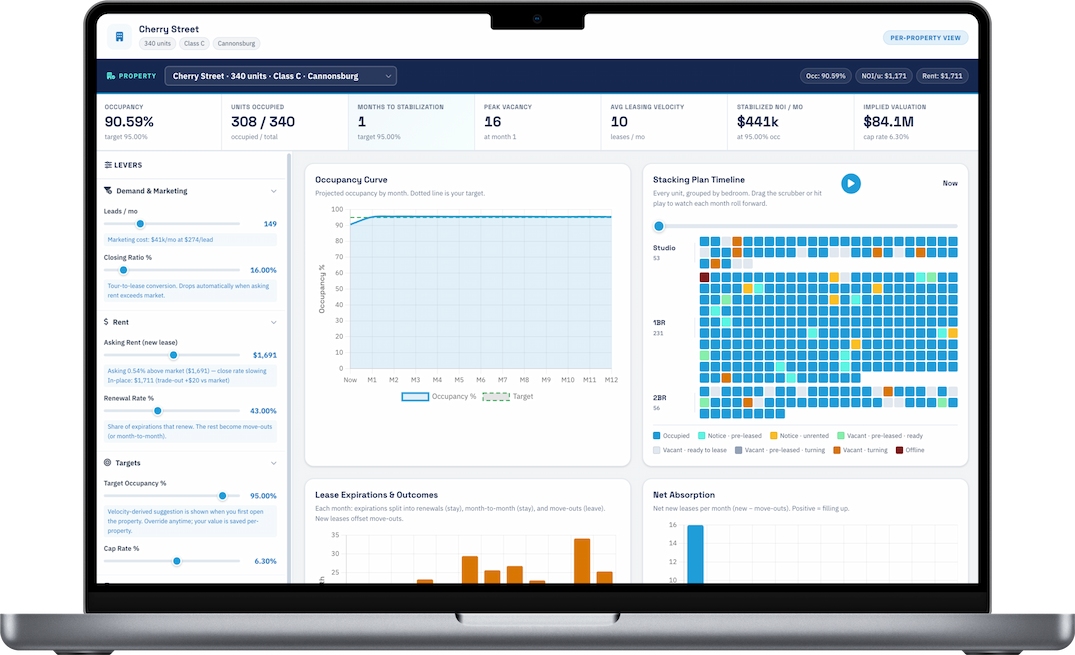
Lease Up Forecast interactive dashboard
Dashboard 02

Lease Up Forecast

Stabilization is the destination. Lease Up Forecast tells you when you'll get there — and what to change if the answer isn't fast enough. Predictive occupancy curves, modeled stabilization timelines, and scenario controls that let your team test the levers before pulling them.

Forecasted stabilization date — a predicted month-to-stabilization based on live velocity, not a static budget assumption
Projected occupancy curve — model the trajectory from where you are today to your stabilized target
Scenario modeling — adjust marketing spend, asking rent, concession structures, and renewal rates to see how each lever moves the forecast
Bring your own data
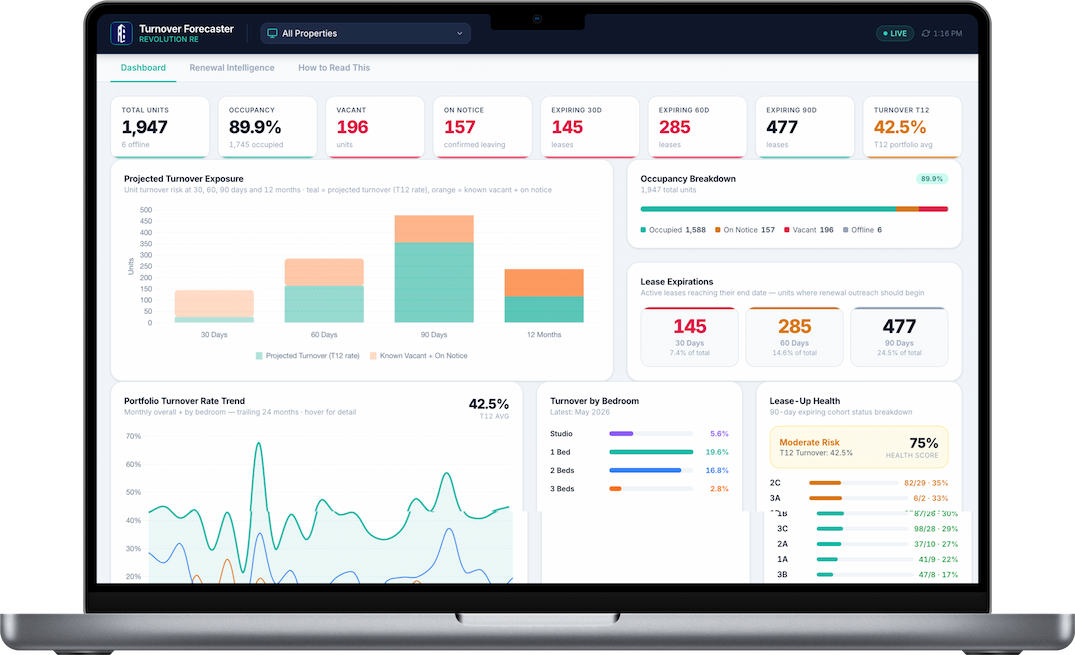
Turnover Tracker interactive dashboard
Dashboard 03

Turnover Tracker

Lease expirations, renewals, new leases, and transfers — all in one live, interactive view per property. Turnover Tracker gives your team a granular unit-by-unit record of every lease event so nothing slips through, and rent trade-outs are visible at a glance.

Unit-by-unit lease history — end dates, lease types, unit types, and market rents in one interactive table
Rent trade-out visibility — previous vs. new lease rent with variance tracked per unit
New leases, renewals, transfers — every lease event type tracked with full context
Bring your own data
How it works

Up and running in days, not months.

Data Plus is designed for speed. Connect your data source, select your reporting, and your team has live portfolio intelligence — no engineering work, no BI configuration, no custom builds required.

Step 01
Connect your data

Share your property management system export or connect via API. Data Plus works with your existing data — no migration or restructuring required.

Step 02
We standardize it

RevRE normalizes your data to a consistent schema — mapping GL categories, unit types, and lease events into a clean, structured format each report can run on.

Step 03
Dashboards go live

Asset Pulse, Lease Up Tracker, and Turnover Tracker are activated for your portfolio. Your team accesses them immediately — no BI Tool setup, no dashboard configuration.

Step 04
Always current

As your portfolio data refreshes, your dashboards update automatically. Your team always has a current view of performance, lease-up status, and turnover — without manual pulls.

No RevRE BI Tool required. Data Plus is a standalone reports package. If you later want custom dashboards, full ETL pipelines, or portfolio-wide BI, you can upgrade to the full RevRE suite — but Data Plus delivers immediate value on its own.

Get started with Data Plus

Portfolio intelligence, ready out of the box.

Data Plus gives your team Asset Pulse, Lease Up Tracker, and Turnover Tracker — three interactive dashboards that run on your data, require no BI Tool, and are live within days. Bring your data. We handle the rest.

See all products
3Reports included
BYODBring your own data
DaysTypical time to live